By Jessica Tryner, 2017-2018 Sustainability Leadership Fellow and Postdoctoral Fellow in the Department of Mechanical Engineering
It’s Labor Day, and I’m driving home from the grocery store. I blink a few times. Is something wrong with my eyes? No. It’s hazy. It’s really hazy. It’s especially noticeable mid-day, when we’re used to seeing sunshine and clear blue skies in Colorado’s Front Range. The haze obscuring the afternoon sun means that the concentration of microscopic particles suspended in the air is high. “How bad is it?” I wonder. 50 µg·m-3? 100 µg·m-3?
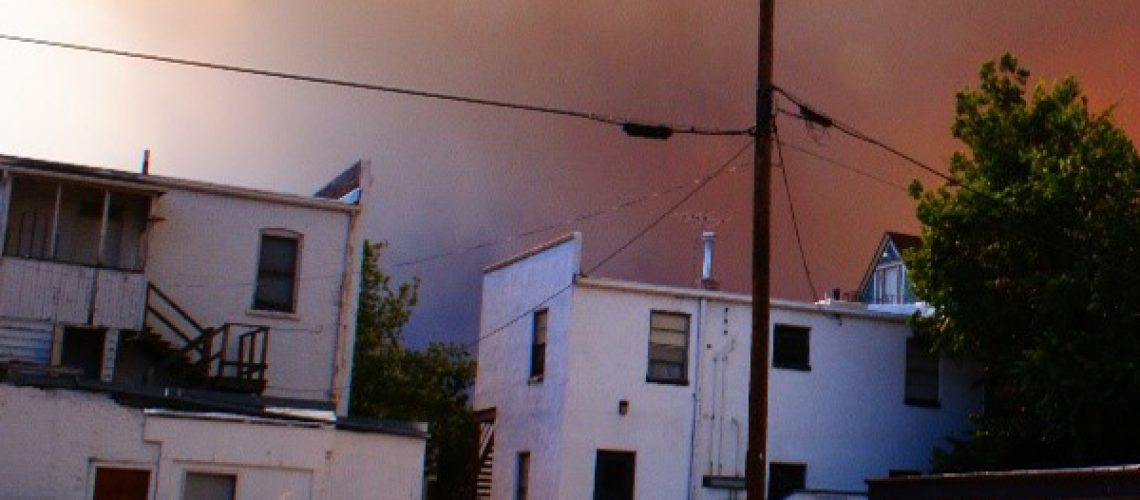
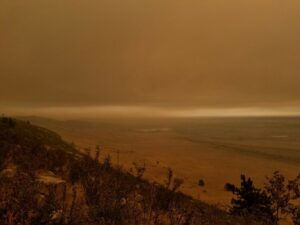
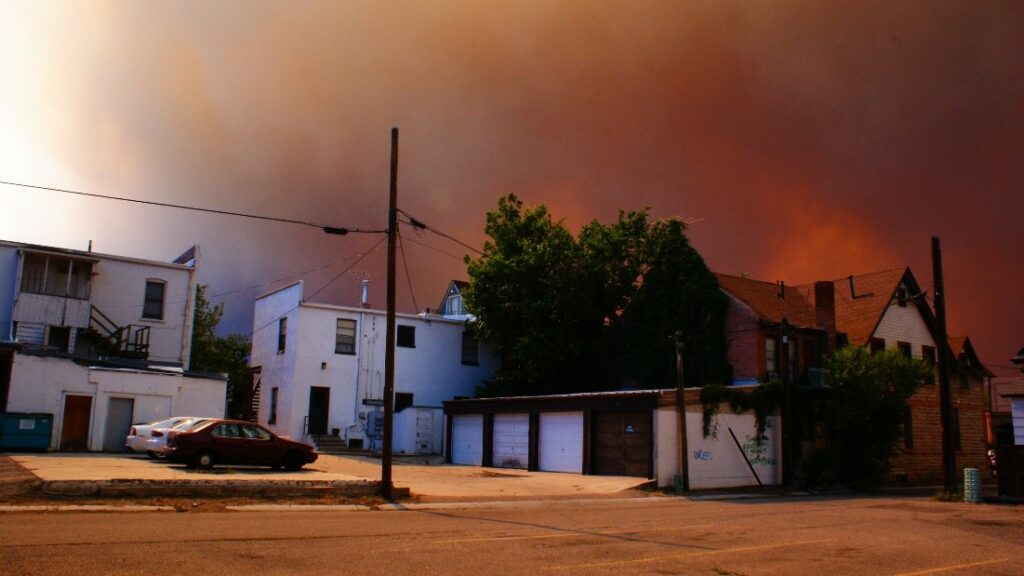
The many small particles—generated by natural sources and human activities—that become suspended in the atmosphere are collectively referred to as “particulate air pollution.” The most extreme particulate air pollution on Colorado’s Front Range occurs when the region is affected by wildfire smoke (see Figure 1). On Labor Day 2017, the Front Range was blanketed in smoke transported from fires in states north and west of Colorado (1), and the concentration of particles smaller than 2.5 µm (abbreviated PM2.5) suspended in the Fort Collins air was more than 8 times the annual average. These elevated PM2.5 concentrations put our health at risk.
Particulate air pollution is all around us—literally! Although the highest levels occur when the Front Range is affected by wildfire smoke, more common sources of particle emissions include motor vehicles and wood stoves—technologies that many of us use daily. When we breathe, small particles penetrate deep into our lungs, and exposure to particulate air pollution has been linked to respiratory and cardiovascular disease (2). Globally, there are 4 million deaths associated with ambient particulate matter pollution each year. Children, the elderly, and people with existing cardiovascular or respiratory disease (e.g., asthma) are more susceptible to particle-related health impacts (3). Ensuring that all people have air that is safe to breathe, both now and in the future, is an important component of sustainability.
In the absence of wildfire smoke, levels of particulate air pollution in Fort Collins are generally below Environmental Protection Agency (EPA) and World Health Organization (WHO) guidelines. Unfortunately, researchers have estimated that 87% of the global population lives in areas where the annual average concentration of PM2.5 in the outdoor air is above the WHO guideline of 10 µg·m-3 (4).
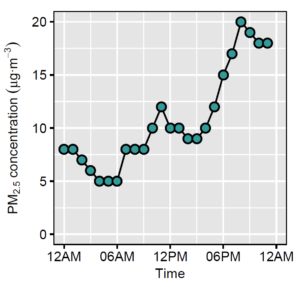
Each state in the U.S. maintains a network of instruments that monitor particulate air pollution at various locations (see Figure 2). If you are interested in air quality, you can access readings from monitors across Colorado here. These monitors take accurate measurements, but they are expensive and require scientific expertise to operate. As a result, measurements are only available for a limited number of locations. For example, Fort Collins is home to the only PM2.5 monitor in Larimer County (which is home to 300,000 people and covers an area of 2600 mi2). Particle sources and concentrations can vary on smaller spatial scales than that.
When I get home from work, I’m greeted with, “You smell like a campfire.” But I haven’t been sitting around a campfire. I just spent 15 minutes riding my bike through Old Town at 9pm on a winter evening (yes, 9pm—I’m a postdoc). As the name of the neighborhood implies, there are a lot of old homes in Old Town. Many old homes feature wood-burning stoves and fireplaces, and these stoves emit particles that impact our local air quality.
To complicate things further, the concentration of particulate air pollution to which we are exposed is not simply equal to the outdoor concentration in the city where we live (5). Outdoor air pollution contributes to our personal exposure, but we are exposed to different concentrations of particulate matter in different locations (e.g., at home, at work, during our commutes) and during different activities (e.g., sleeping, cooking, cleaning) (6). For example, a study of commuters in Fort Collins found that cyclists were exposed to higher levels of particulate air pollution than people who commuted by car (7).
To reduce our exposures, we need to know how particulate matter concentrations vary from one location to the next, where the particles in those different locations are coming from, and which of our daily activities result in the highest exposures. To characterize particulate air pollution in a greater number of locations, we need monitors that are affordable, portable, and accurate. We need unobtrusive wearable monitors that can measure an individual’s personal exposure to PM2.5 (8), and small stationary monitors that citizen scientists (that can be you!) can use to measure levels of particulate air pollution in their own backyards.
Sunshine poured into my living room. Did that mean that big cloud had gone away? I wandered out into my backyard and tried to look at the sun. “Ow,” I thought, “That’s why they told you not to look directly at the sun when you were a kid.” It looked like the big cloud was still there, though. The sunlight was peeking through it, but the sun itself was still obscured…Like most things in research, this was turning out to be more difficult than I expected.
As part of my research, I help develop and test backyard monitors (see Figure 3) that citizen scientists can use to measure particulate air pollution levels. Inside one of these monitors, air is pulled through a filter for 48 hours. Particles are trapped on the filter, and the filter is weighed to determine the average mass of particles per unit volume of air during that 48-hour period. The monitors also quantify the amount of sunlight that doesn’t make it through the Earth’s atmosphere due to
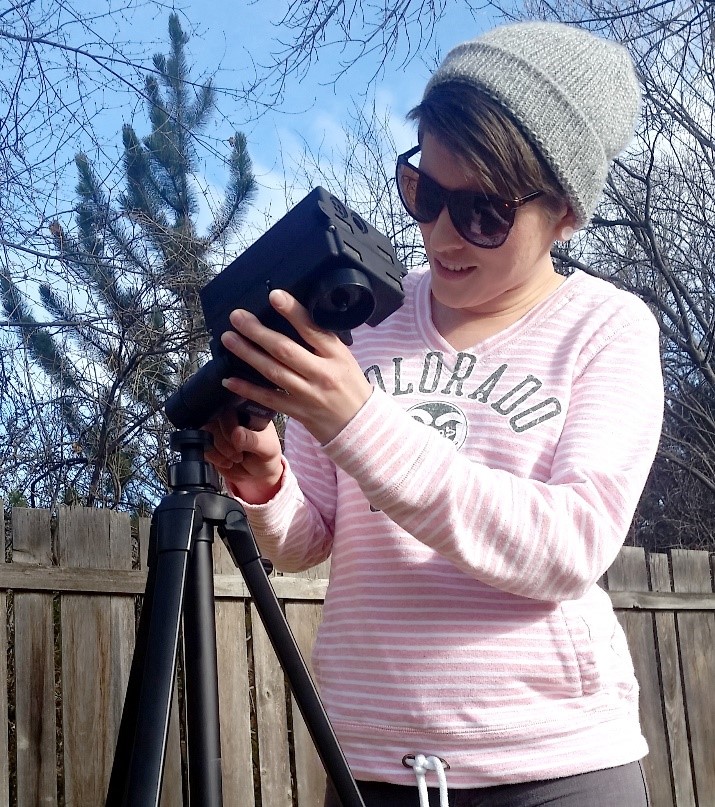
particulate air pollution (a quantity called “aerosol optical depth”). That’s why I needed a clear view of the sun. Why measure aerosol optical depth? Because satellites circling the Earth also measure the amount of light attenuated by the atmosphere. The satellite measurements can be used to generate global maps of particulate air pollution, but, to do that, they need to be related to of the quantity of interest: the mass concentration of PM2.5 at ground level (9). By establishing a dense network of monitors that measure aerosol optical depth and PM2.5 mass concentration simultaneously, we can help improve these maps and gain a better understanding of PM2.5 concentrations in locations that lack ground-based monitors. The citizen scientists who take these measurements gain a better understanding of pollution levels in their own backyards and contribute to a better understanding of regional and global air pollution.
Particulate air pollution is a problem that we all contribute to and are affected by, but with researchers and citizen scientists working together—using accurate, affordable PM monitors—we can all be part of the solution.
References
- B. Ford, Labor day, a holiday up in smoke. Fort Collins Air Qual. (2017), (available at http://ftcollinsaq.blogspot.com/2017/09/labor-day-holiday-up-in-smoke.html).
- J. O. Anderson, J. G. Thundiyil, A. Stolbach, Clearing the Air: A Review of the Effects of Particulate Matter Air Pollution on Human Health. J. Med. Toxicol. 8, 166–175 (2012).
- J. D. Sacks et al., Particulate Matter–Induced Health Effects: Who Is Susceptible? Environ. Health Perspect. 119, 446–454 (2010).
- M. Brauer et al., Ambient Air Pollution Exposure Estimation for the Global Burden of Disease 2013. Environ. Sci. Technol. 50, 79–88 (2016).
- W. E. Wilson, M. Brauer, Estimation of ambient and non-ambient components of particulate matter exposure from a personal monitoring panel study. J. Expo. Sci. Environ. Epidemiol. 16, 264–274 (2006).
- L. Wallace, R. Williams, A. Rea, C. Croghan, Continuous weeklong measurements of personal exposures and indoor concentrations of fine particles for 37 health-impaired North Carolina residents for up to four seasons. Atmos. Environ. 40, 399–414 (2006).
- N. Good et al., The Fort Collins Commuter Study: Impact of route type and transport mode on personal exposure to multiple air pollutants. J. Expo. Sci. Environ. Epidemiol. 26, 397–404 (2016).
- J. Volckens et al., Development and evaluation of an ultrasonic personal aerosol sampler. Indoor Air. 27, 409–416 (2017).
- A. van Donkelaar et al., Global Estimates of Ambient Fine Particulate Matter Concentrations from Satellite-Based Aerosol Optical Depth: Development and Application. Environ. Health Perspect. 118, 847–855 (2010).
