Guest Post by Megan Pierson, Undergraduate Student in the Department of Ecosystem Science and Sustainability
Nitrogen pollution, despite wide reaching and severe environmental and health effects, does not receive anywhere near the same attention as carbon pollution. Carbon neutrality and footprint reduction to reduce global warming are at the center of sustainability conversations, where nitrogen (N) is often absent. Nitrogen neutrality is not possible in the same way carbon neutrality is, so approaches are often different. Nitrogen can be reduced through decreased burning of fossil fuels, much like carbon can. However, N fertilizers used in agriculture add to pollution because of the food we consume, and N so far cannot be used with 100% efficiency. This is especially true for meat products. The consequences of N pollution — such as aquatic dead zones, smog, loss of biodiversity, and contaminated groundwater – are dangerous and cannot be ignored. This creates a uniquely challenging problem of trying to find the right balance between reducing nitrogen pollution and offering nitrogen offsets, without the same level of attention and concern that is extended to carbon reduction strategies.
One important and emerging tool used to quantify N pollution is the creation of a nitrogen footprint. I am extremely proud to have worked on CSU’s nitrogen footprint team for 2020. Nitrogen footprints estimate the total reactive N released into the environment within the bounds of a system. Nitrogen footprint calculations are relatively new, with development and implementation only occurring in the last decade or so. Having figures to show the complete scope of N emissions is a great way to highlight areas of potential reduction. When all sources of N pollution are compiled, it is easy to see which areas contribute the most, which is where reduction efforts should be based. Footprint data can be used to simulate how reactive N emissions may change under different management scenarios. Scenario results and figures give validity to reduction strategies and recommendations. Having tangible figures is invaluable when discussing the future of reactive N management with those who make management decisions.
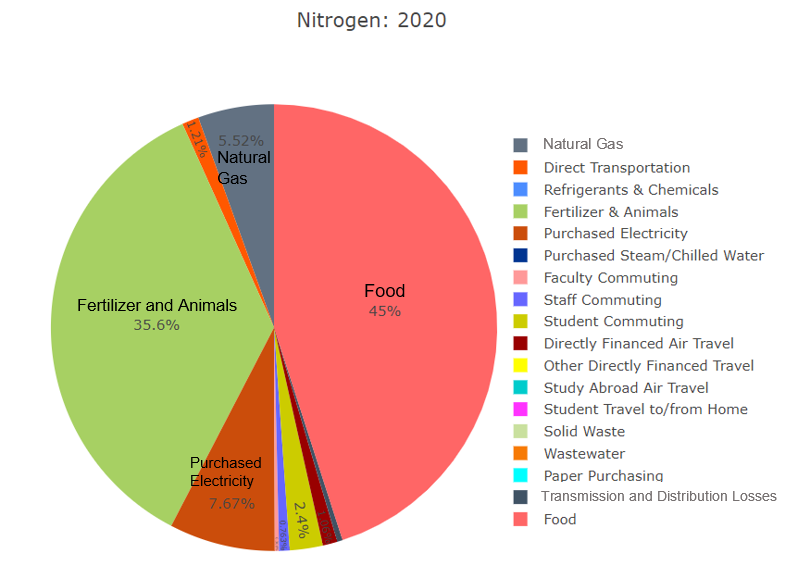
It may be easy to dismiss the effects of nitrogen until you can see exactly how much Colorado State University is responsible for. Seeing nitrogen pollution quantified via a footprint is a great way to raise awareness and a great motivating factor for change. Footprints are influenced by people’s decisions, and everyone involved gains a new awareness about the effects of nitrogen for sustainability and health. Results are easily summarized, and easy to distribute in quick infographics, like the ones another member of my team, Cody Sanford, created (Figure 1).
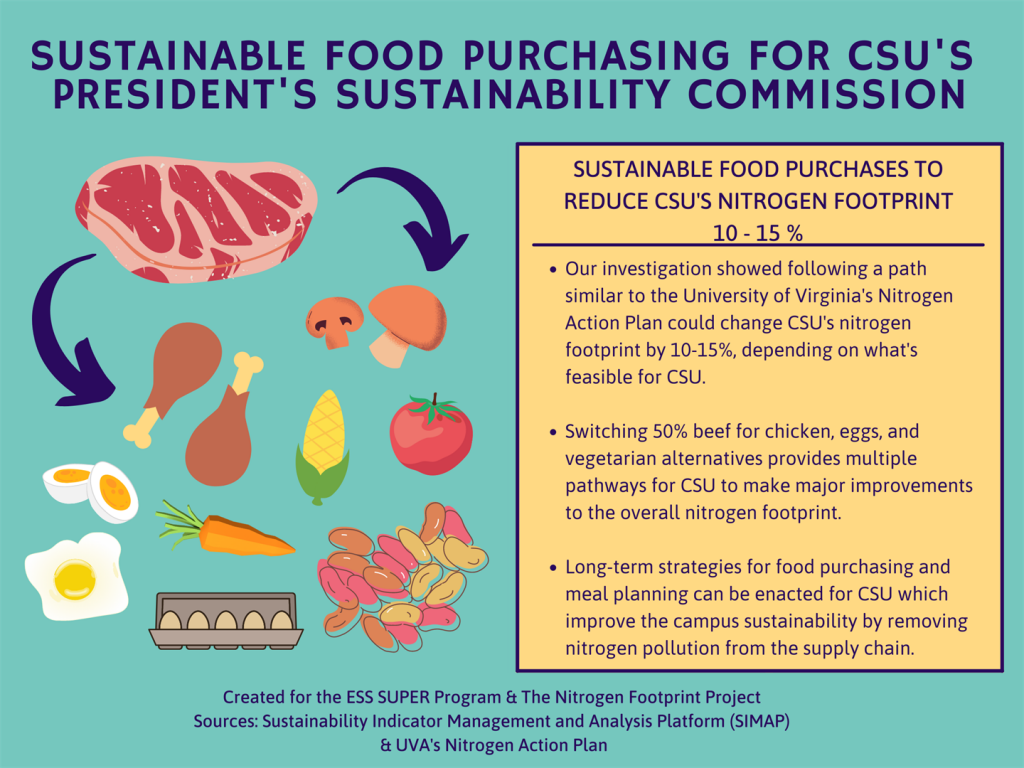
When calculating the nitrogen footprint for 2020 at CSU, I worked mainly with food footprint estimations, putting many hours of work into spreadsheets quantifying and categorizing different food purchases. Food is where we propose CSU focuses their reduction efforts since it is the source of 45% of the University’s footprint (Figure 2). This footprint was only the third one of its type calculated by CSU, and though it was not a normal year due to the shutdown, it contributed to a baseline estimate of what is normal for CSU, and helped us understanding potential year to year variability. This work has allowed us to raise awareness of the importance of N pollution considerations and develop and propose clear N reduction strategies. Our main recommendation for CSU to reduce its N footprint is to reduce beef purchases.
CSU’s efforts to reduce the University’s N footprint is a work in progress. We are grateful that our mentors, Jill Baron of the Natural Resource Ecology Laboratory, Allison Leach of UNH, and Stacey Baumgarn of CSU Facilities, have invited students to participate in this foundational and groundbreaking sustainability effort.
—
About the Nitrogen Footprint Project
The Nitrogen Footprint Project is an endeavor to track the nitrogen use of CSU’s campus. This student-led project was started by members of the Student Sustainability Center, housed at the School of Global Environmental Sustainability. The project placed CSU among the world’s first institutions to calculate its nitrogen footprint and continues to innovate and inform sustainability on campus. In 2020-2021, the calculation of nitrogen was done by Megan Pierson and Cody Sanford as part of their project for the Skills for Undergraduate Participation in Ecological Research (SUPER) Program. Their research poster, “CSU’s Nitrogen Footprint and Potential Reduction Strategy” won an award for Energy Institute – Excellent in Energy and Climate Solutions at the 2021 Celebrate Undergraduate Research and Creative showcase. View the poster here.